stock-diagrams
These are some stock diagrams I made in Figma. Check out the figma source if you wanna see how these were made
Diagrams
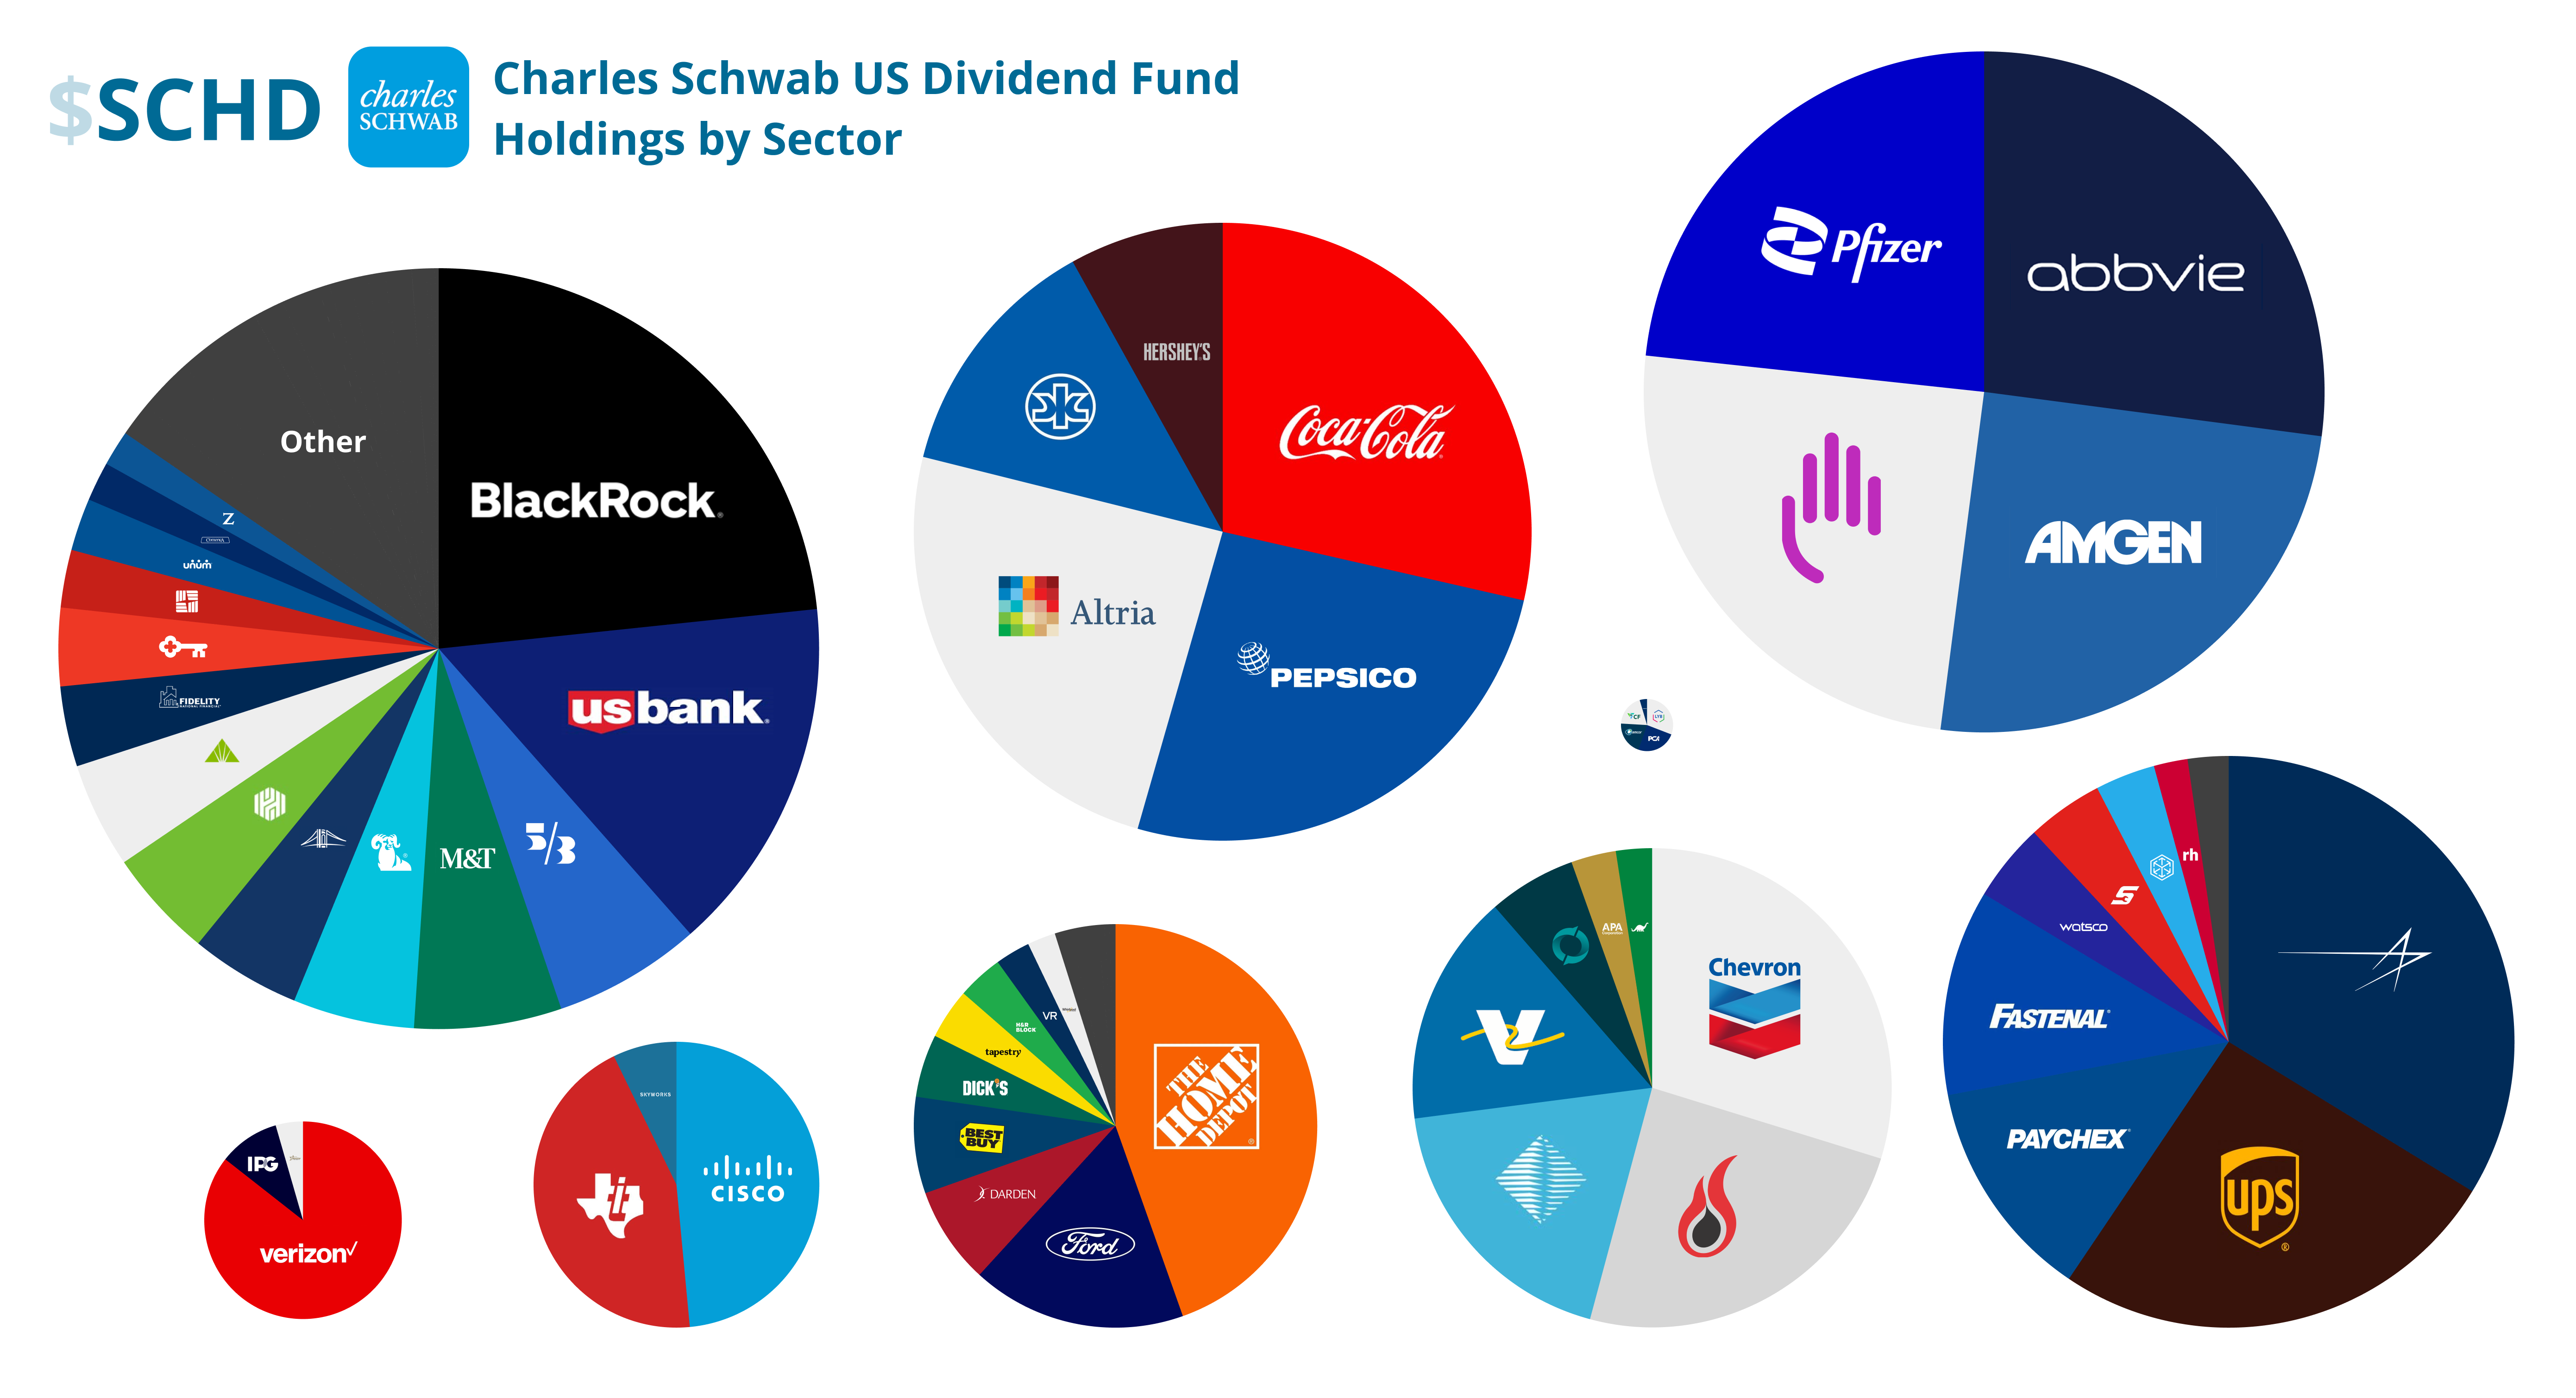
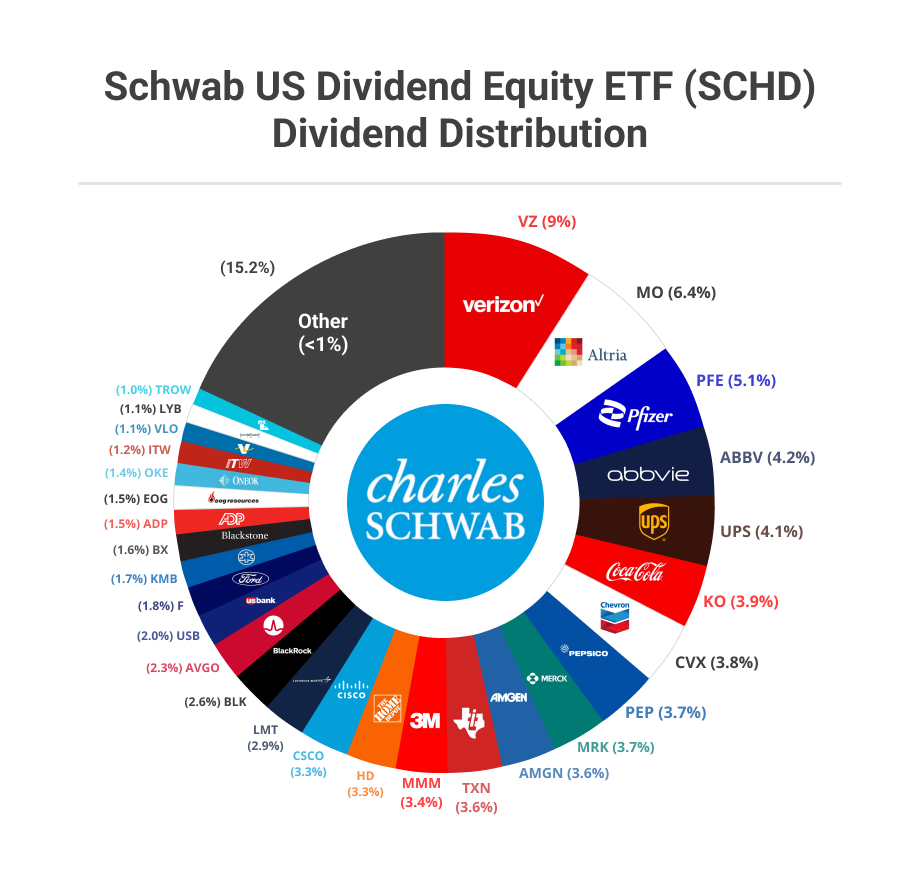
SCHD
Bubble Map by Sector (unknown source date)
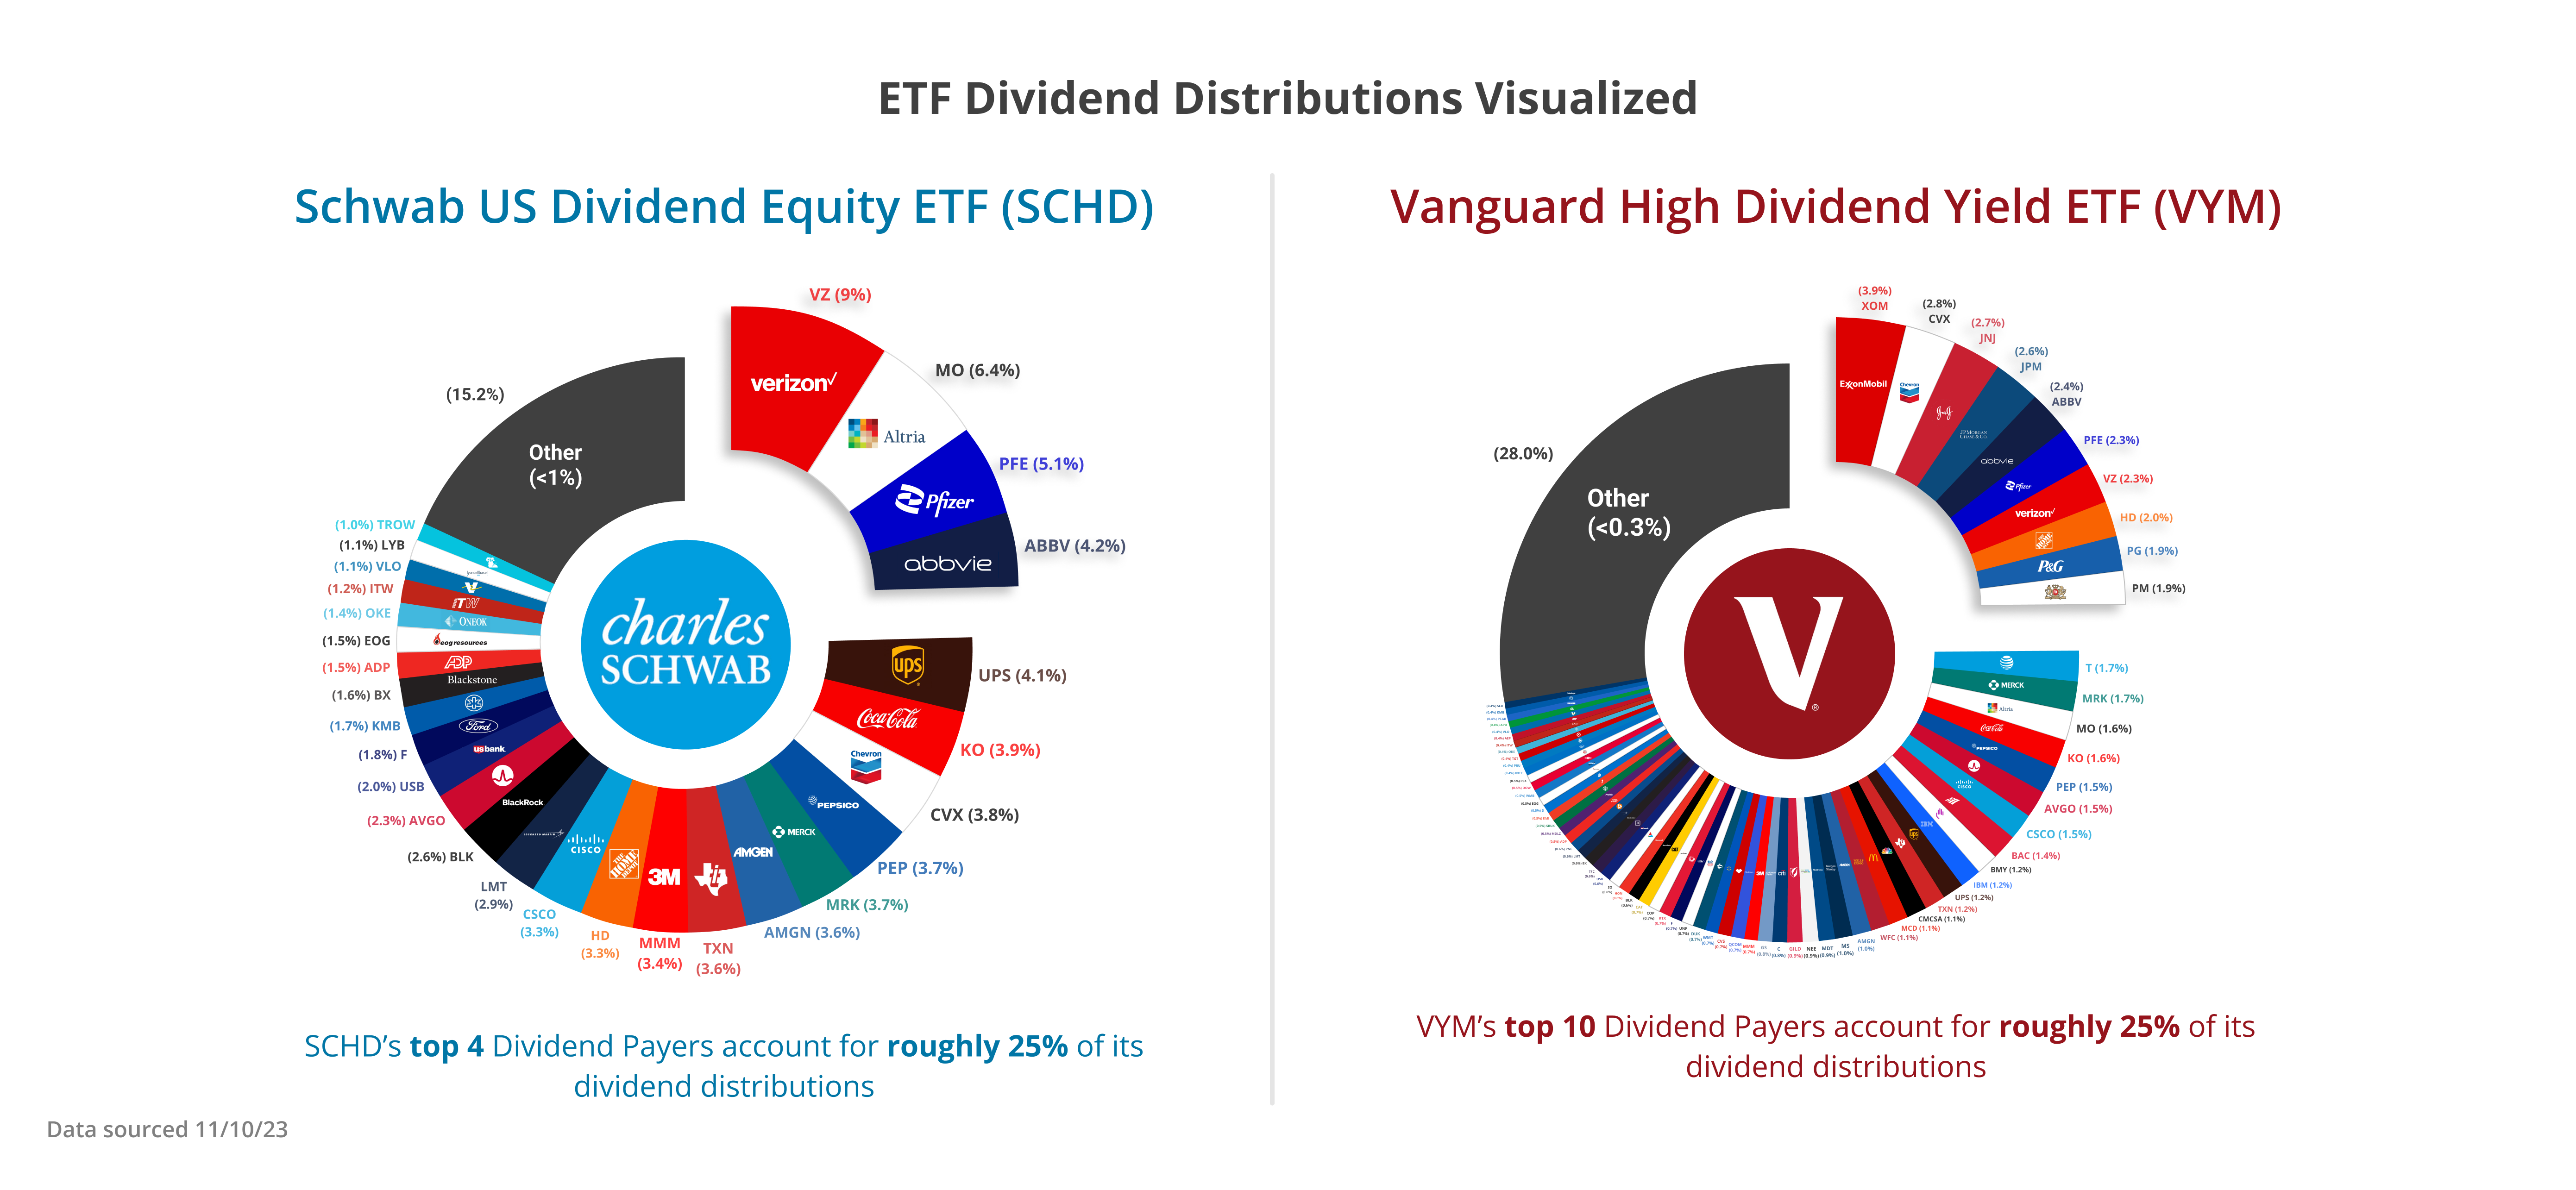
Dividend Distribution (unknown source date)
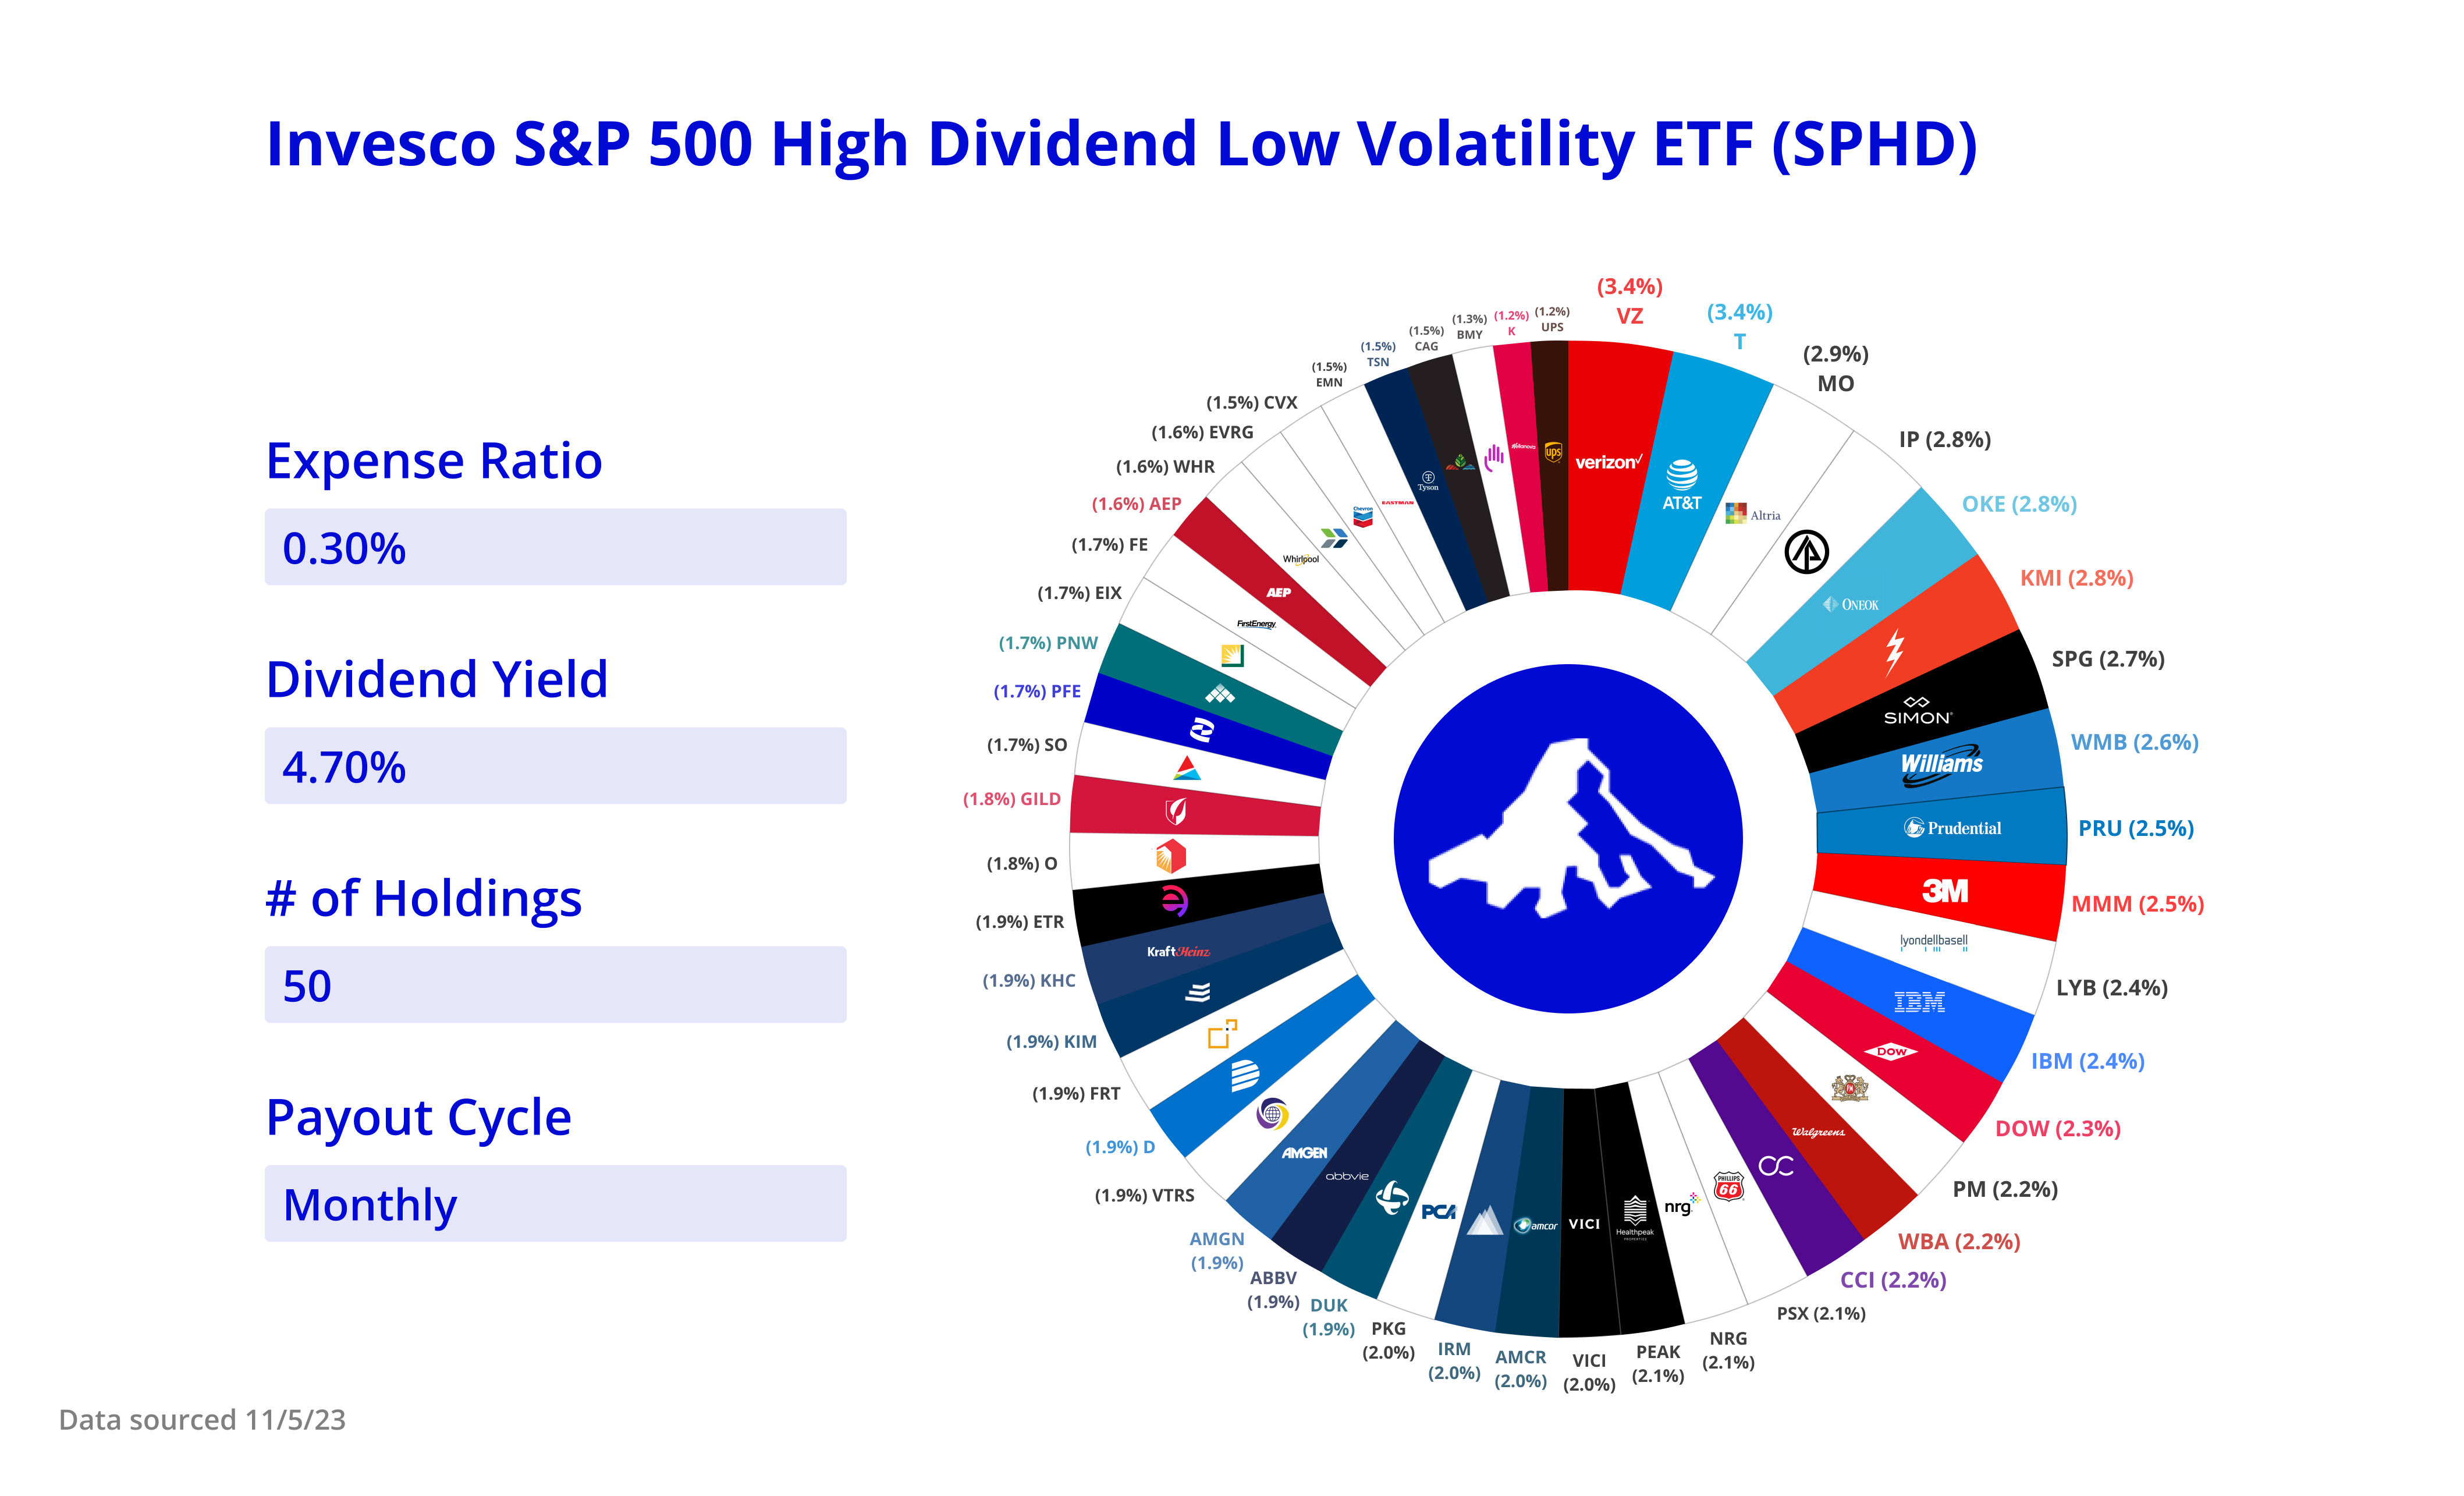
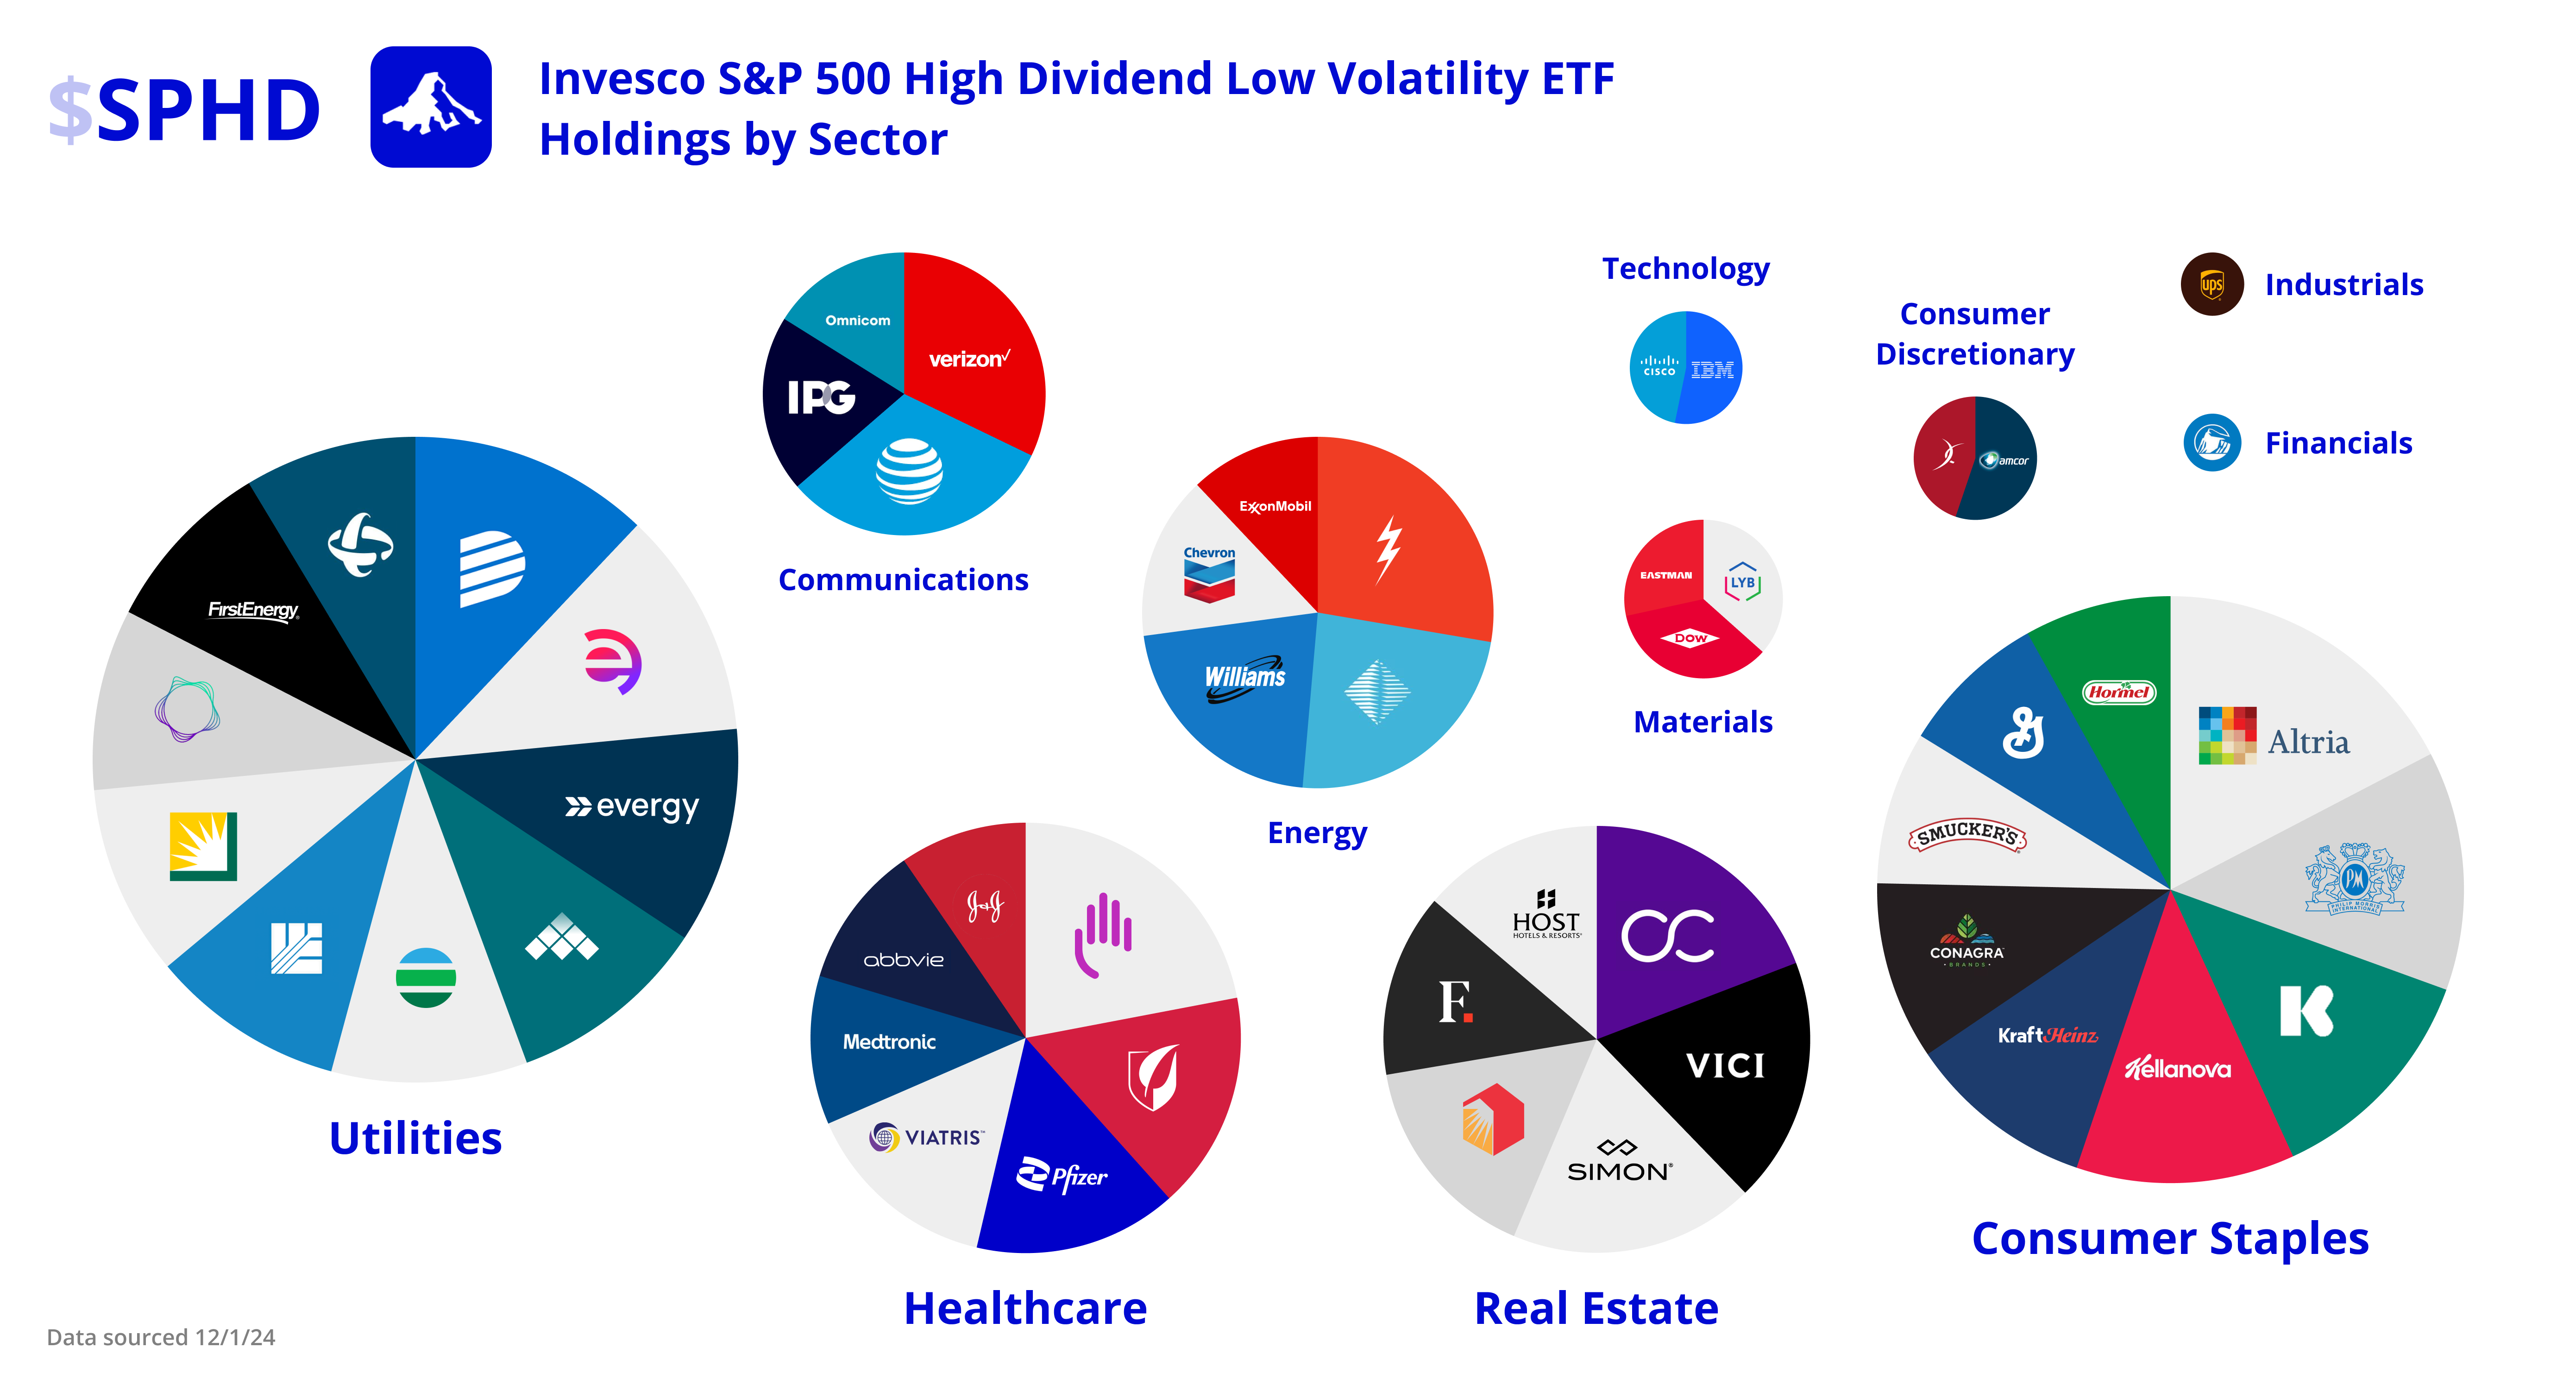
SPHD
Portfolio Composition
Bubble Map by Sector
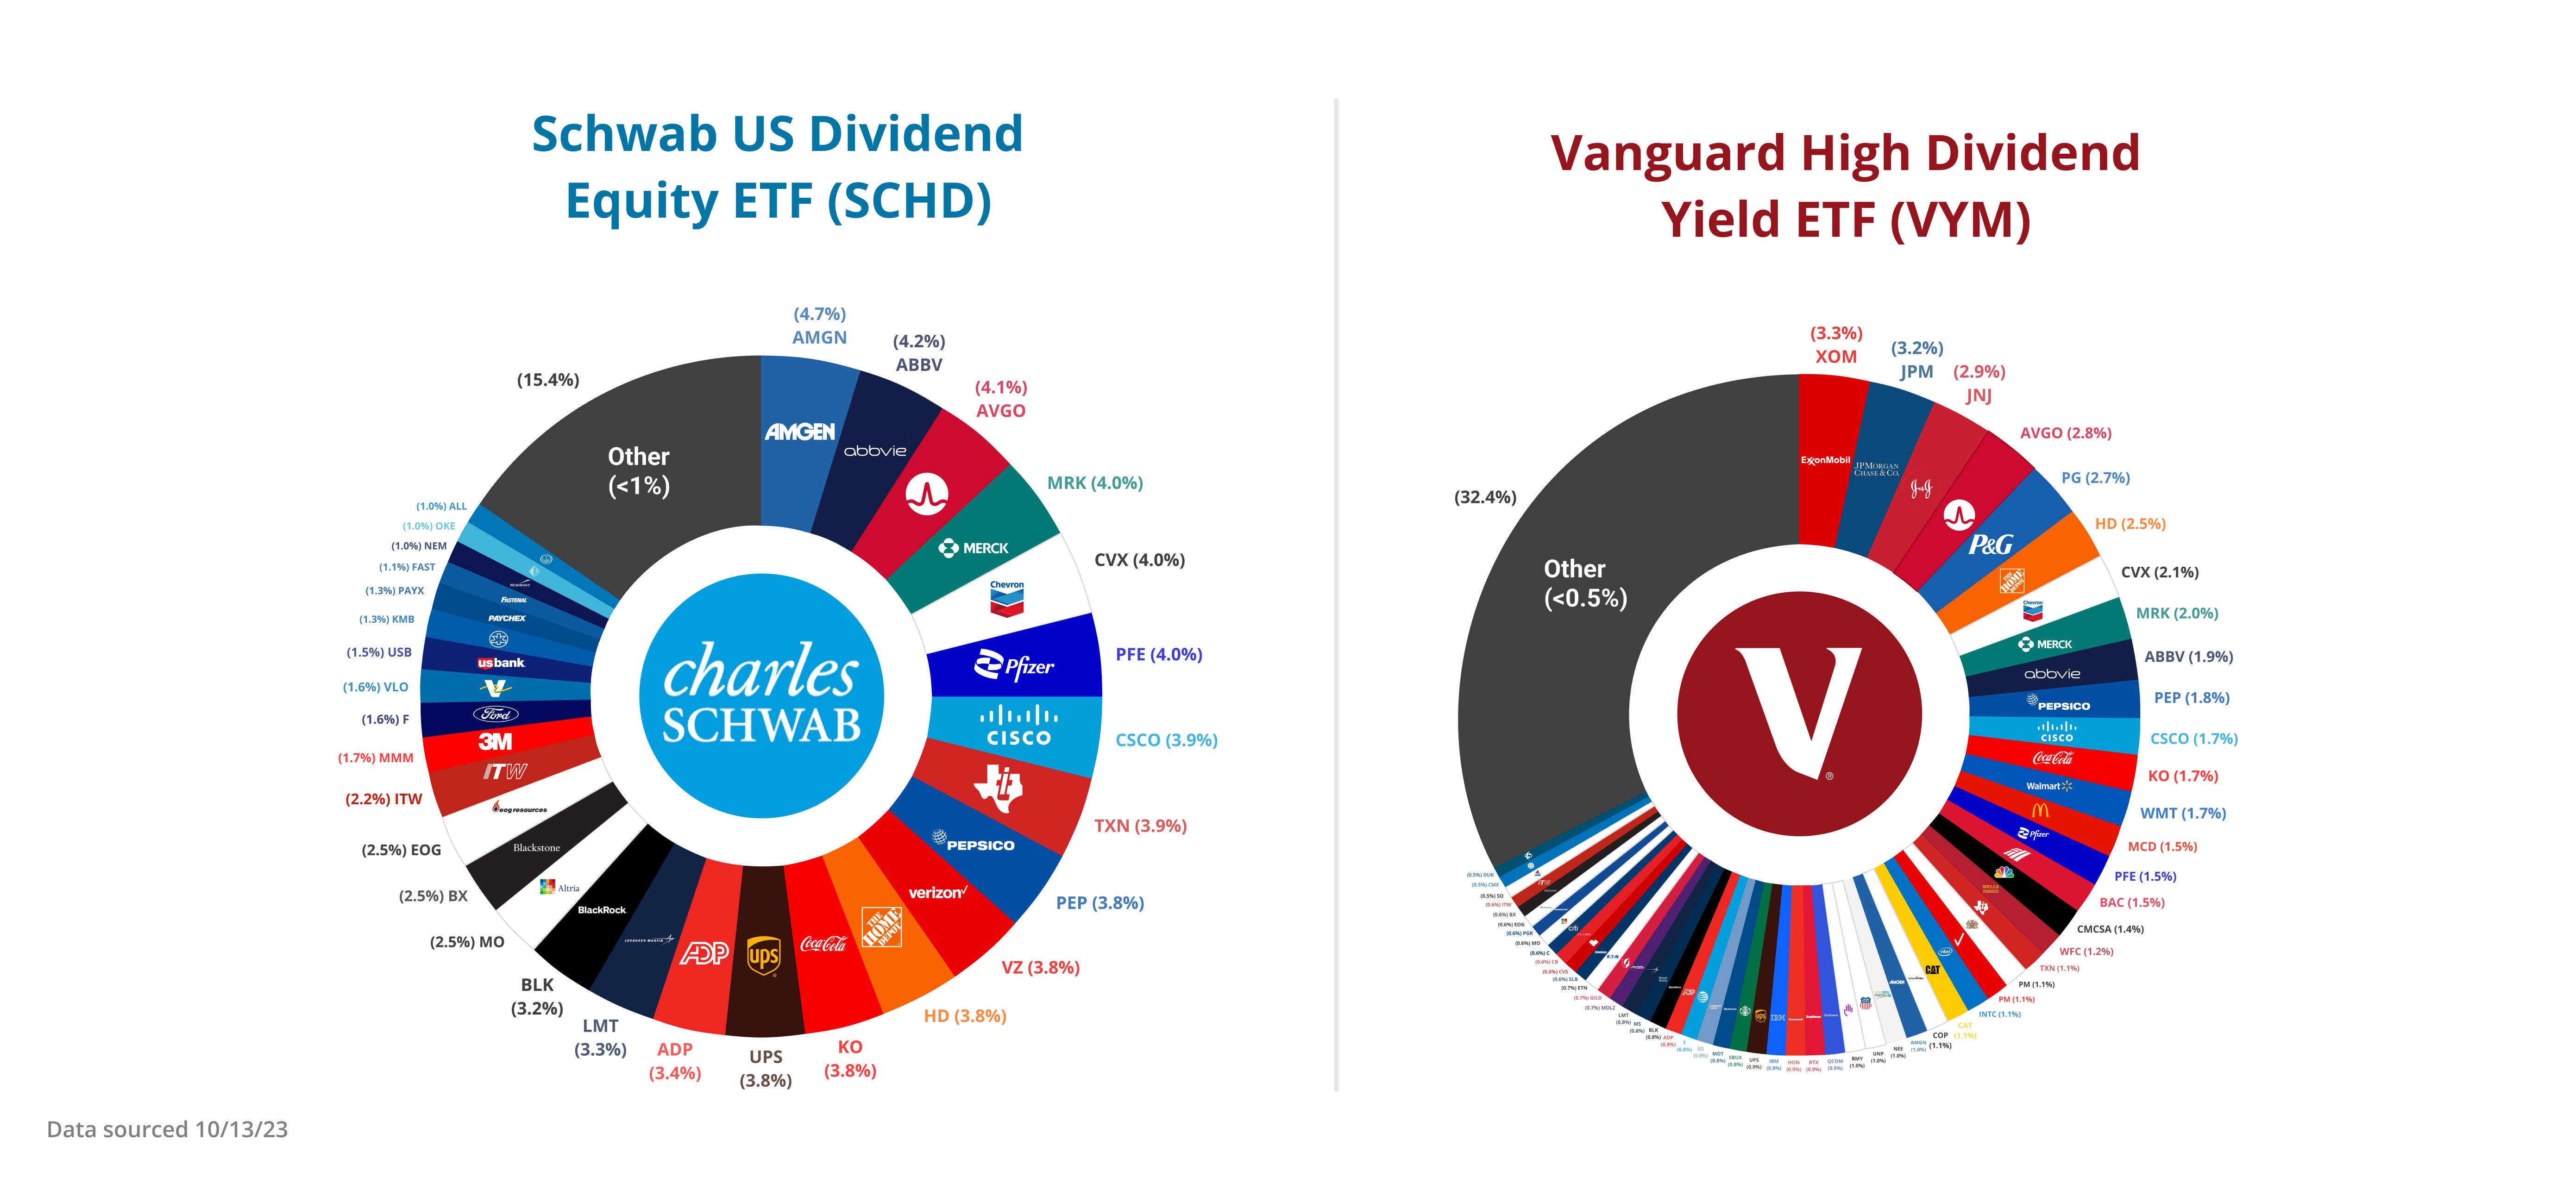
SCHD vs VYM
Portfolio Composition
Dividend Distribution
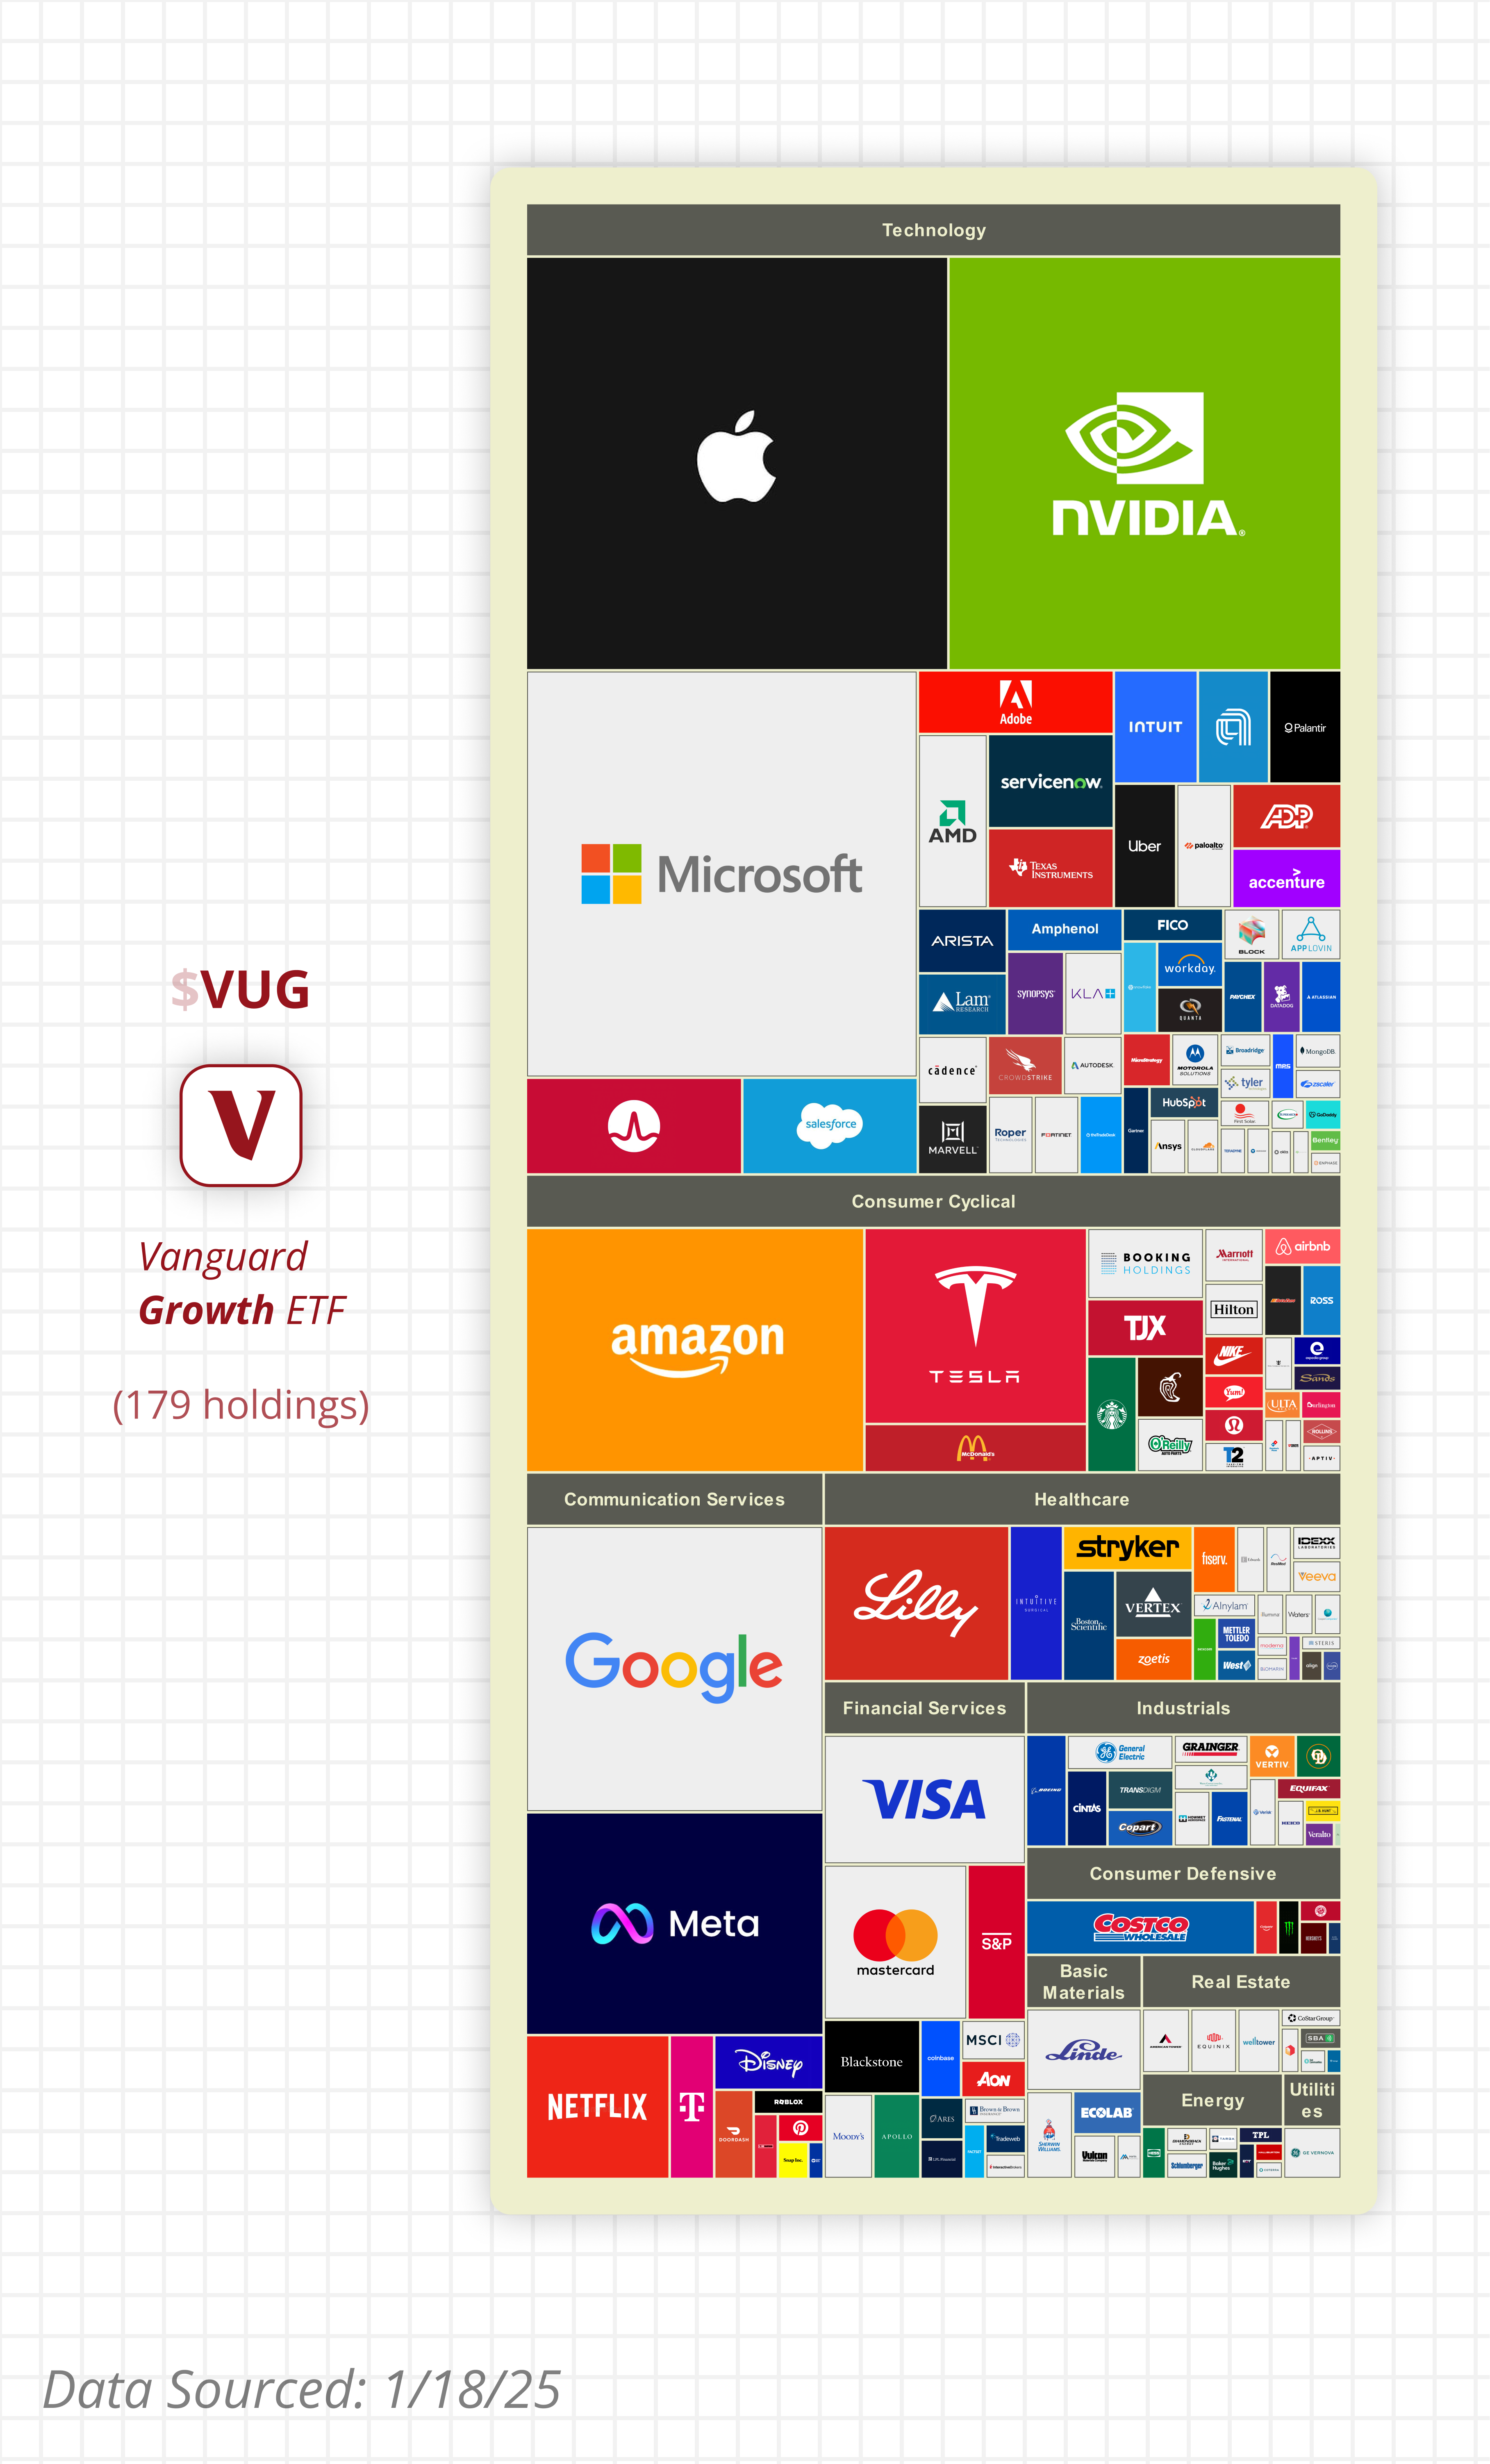
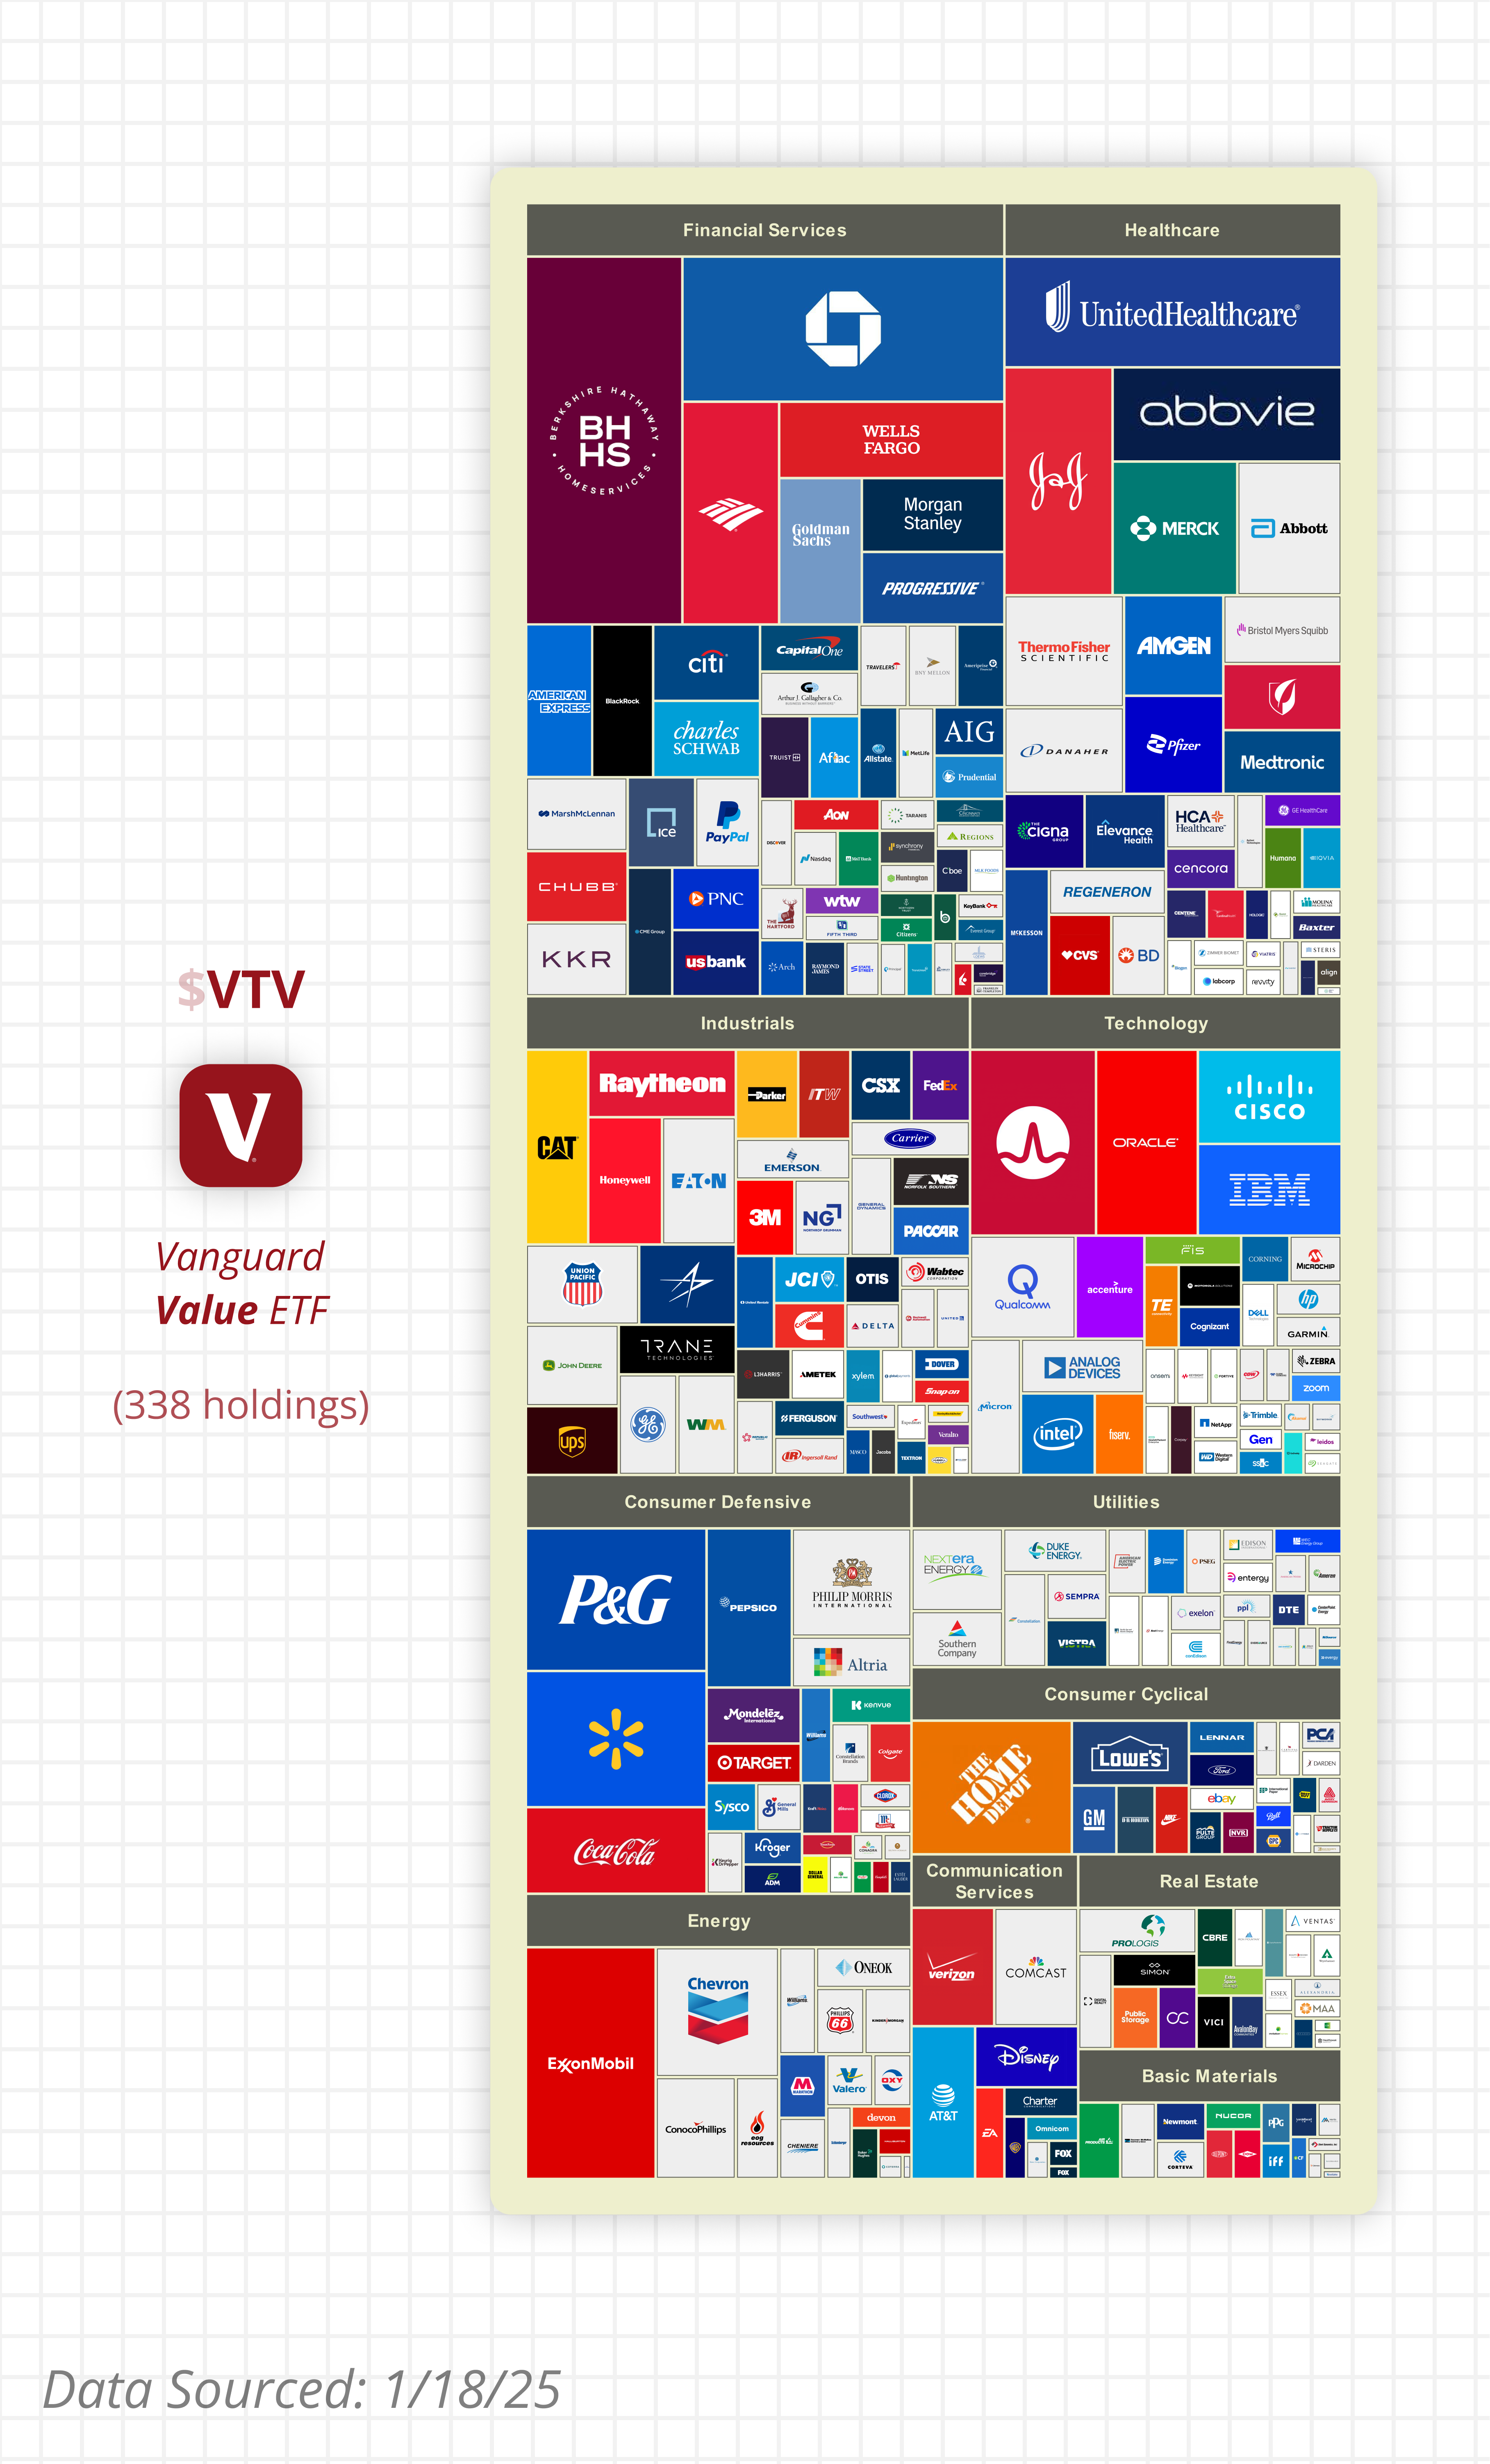
VTV vs VUG
$1 visualized comparison
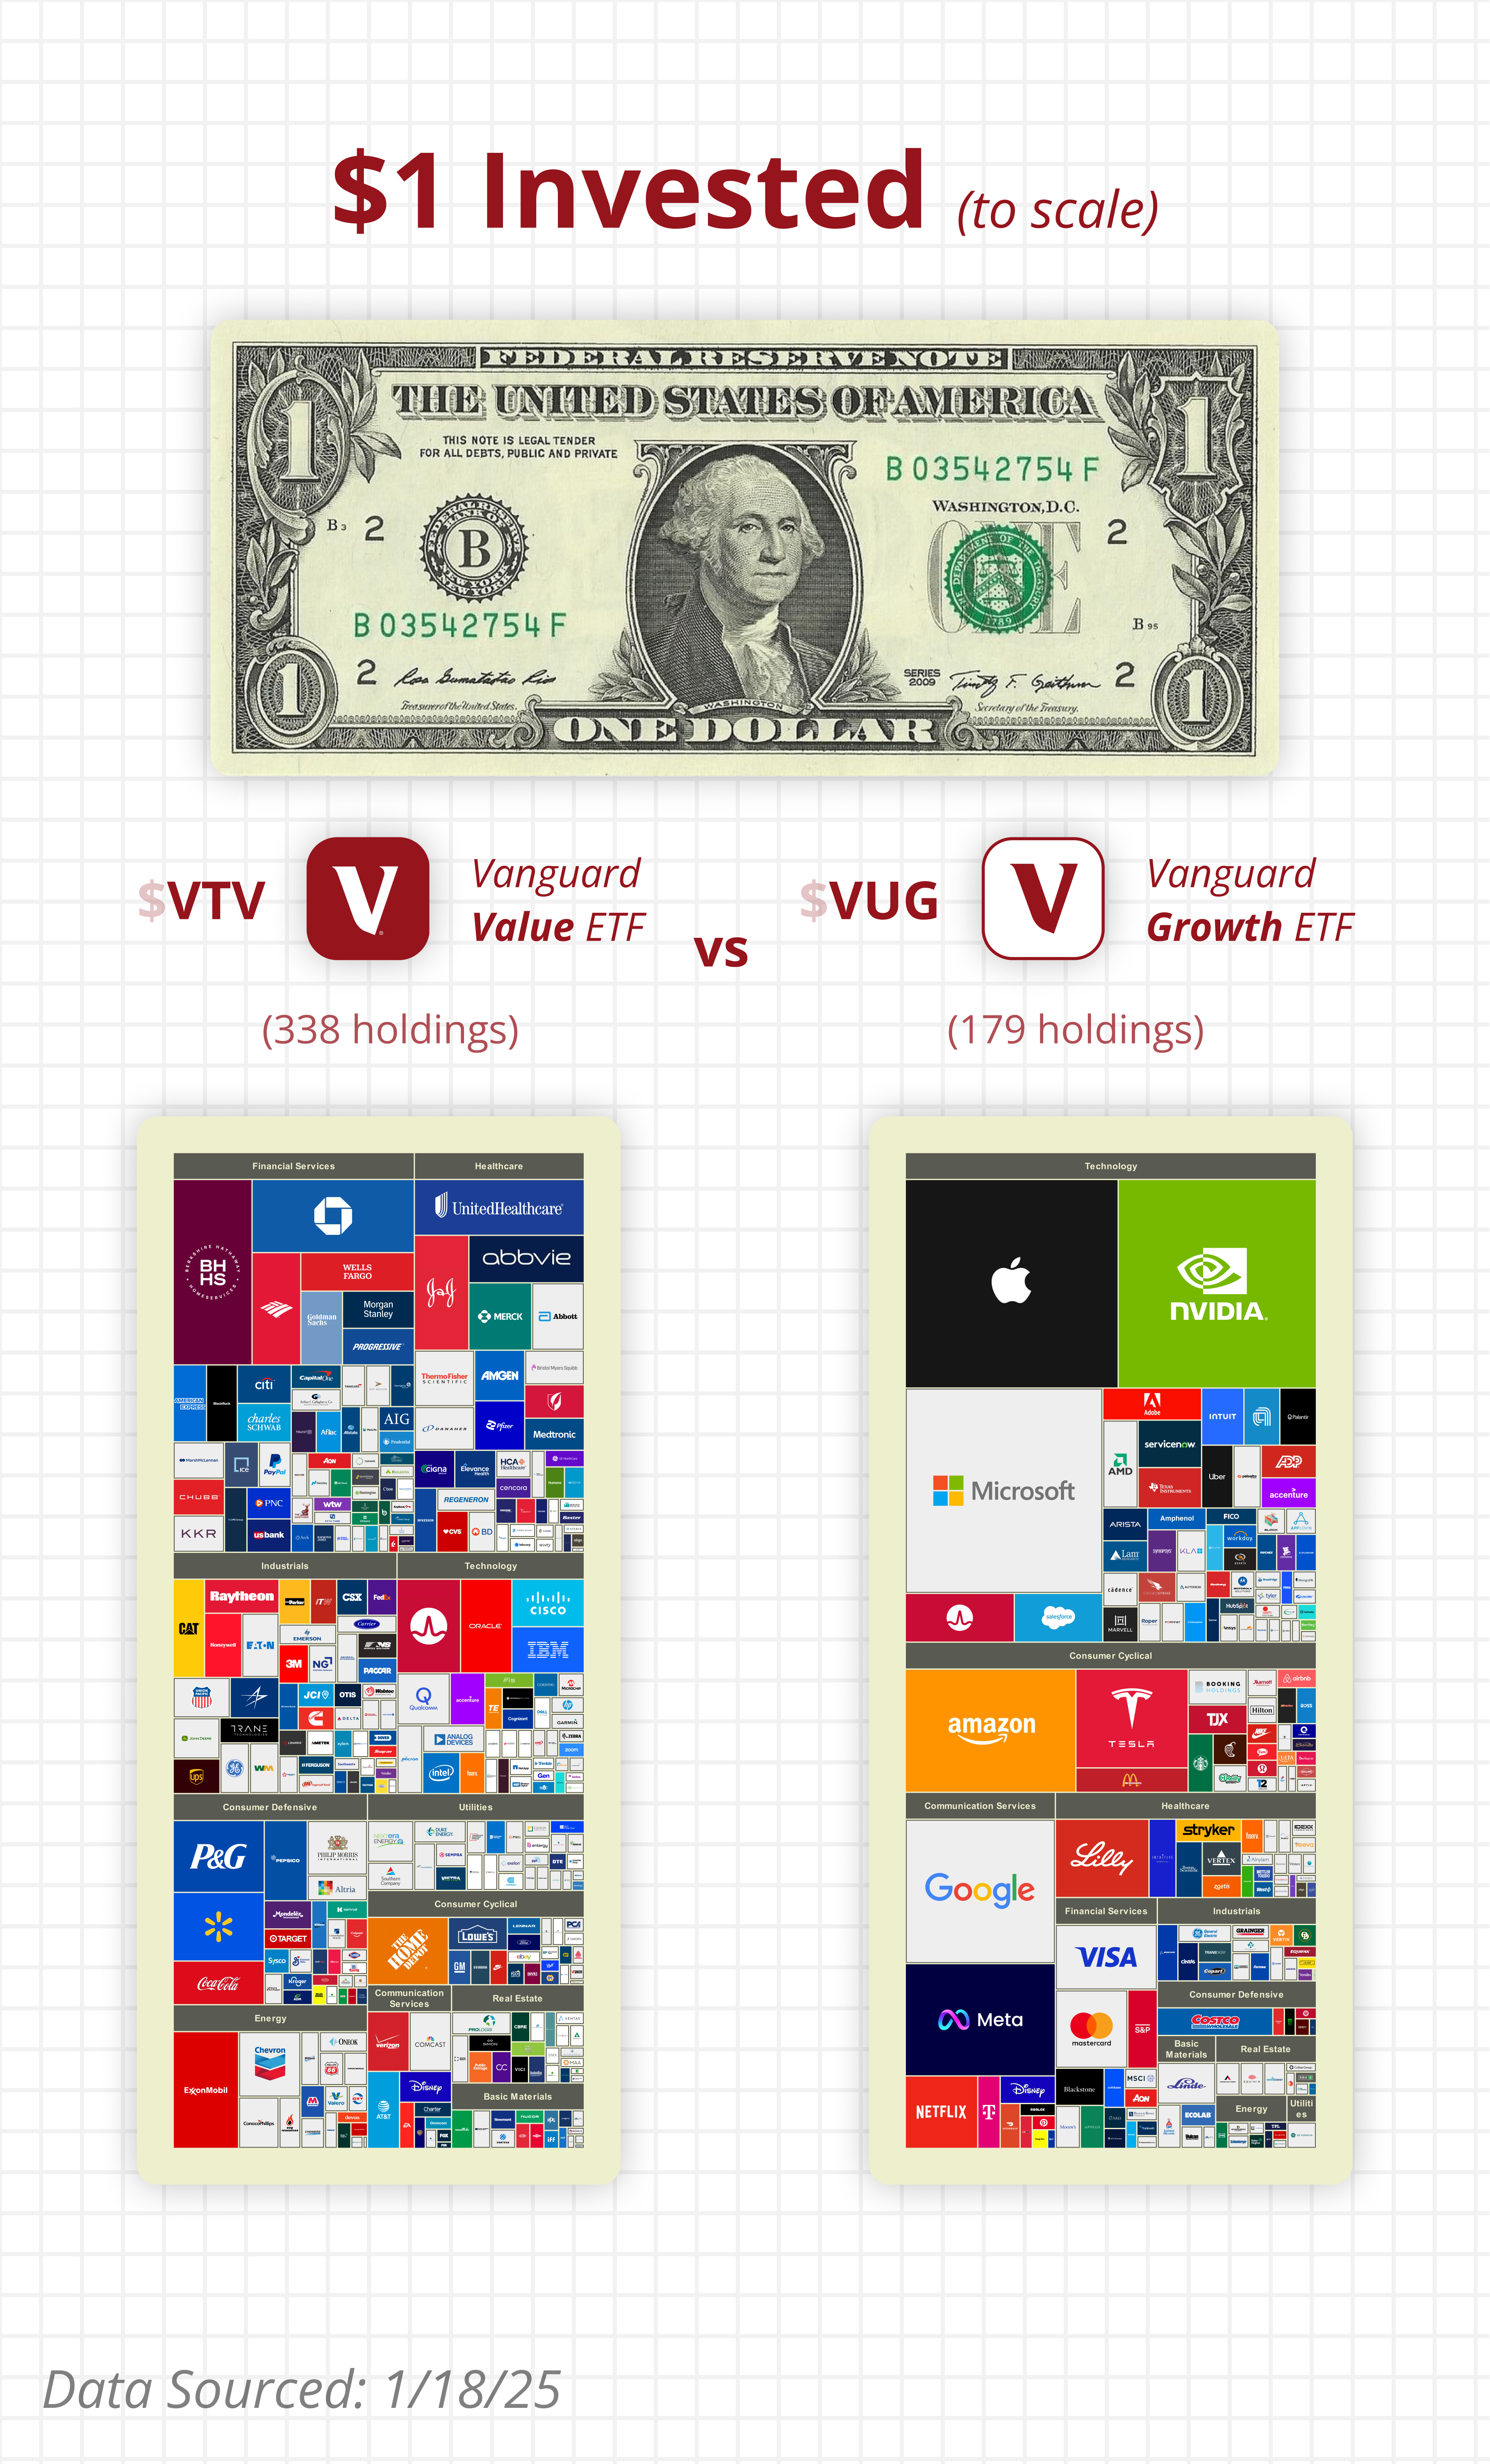
$1 invested in VTV
$1 invested in VUG